… and that script errors don’t have corresponding line numbers, so you can see where your script is going wrong? Debugging by guesswork is such a crazy way to write software.
I’ve used this slightly tedious M.O.:
--- at the start
set errLoc to 4001


-- then sprinkle your script with ever increasing values of errLoc:
set errLoc to 4002
-- more code
set errLoc to 4003

-- when reporting an error, report it with the latest value of errLoc
-- if it says '4002' you know the script didn't make it to the next value of errloc
My current script is up to 328 lines long (and growing) and tracking down where these errors are coming from has gotten completely insane.
I rarely use Script Editor so I can’t comment on that but Script Debugger has a line number option and as the name implies, robust debugging tools.
It was mentioned that Script Debugger has a line number option. The compile button in Apple’s Script Editor usually (but not always) highlights the line of code having a syntax error or may even throw a dialog box. Sometimes, you may need a seance to find the problem…
I deliberately misspelled “scripting additions” in Script Editor and the resulting dialog from the compile phase showed this clue:
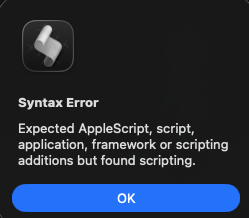
So didn’t need a line number in this case.
Since I write code in several languages, my go to programmer’s editor happens to be a paid version of SublimeText 4. Regardless of the language, including AppleScript, there are line numbers.
There is a free, third-party package for Sublime Text 4 named AppleScript Extensions. It allows one to press shift+command+B to open a menu allowing one to do the following:
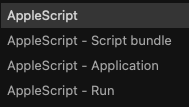
where AppleScript is the equivalent of pressing the compile button in Script Editor or Script Debugger. This opens a window at the bottom of the Sublime Text editor where the results of compliing the AppleScript are displayed. Even the line number where any error occurred and comparable text to what appeared in the preceding dialog. The AppleScript Extensions package utilizes the osalang, osascript, or osacompile tools.
Since Sublime Text 4 uses TextMate theme bundles, I have configured it to use Mac Classic strictly for AppleScript language files. When I open an AppleScript file in it, this is the view:
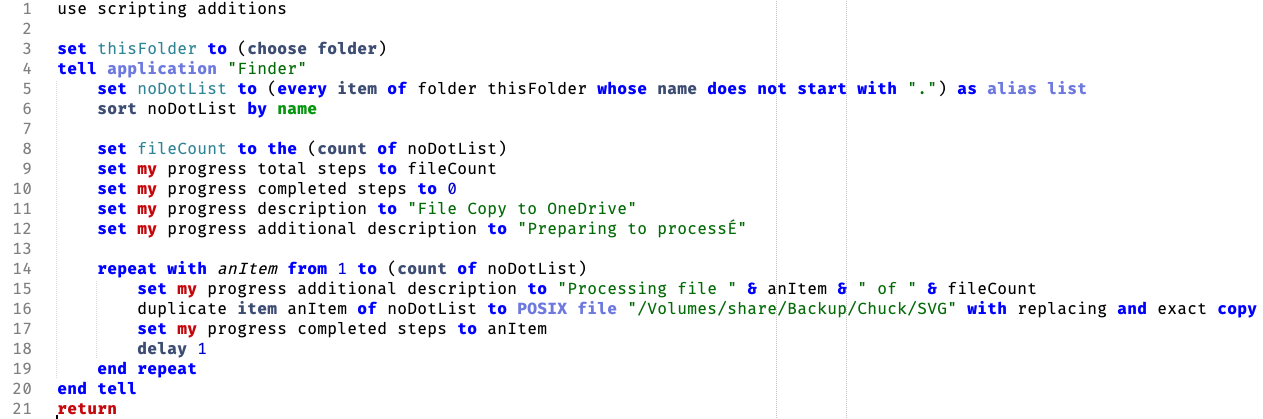
Clearly, this is not as sophisticated as Script Debugger, but it does allow me to focus on one interface for multiple programming languages. It will even visually syntax check Python3, Ruby, and Swift 6 code with associated packages and tools.
Any AppleScript code that I post here will be tested in Script Debugger, Script Editor, and if relevant, Run AppleScript in an Apple Shortcut.
1 Like
Another thing you can do while debugging is use a try statement in handlers and include the handler name in a dialog or alert. That is especially handy when using stuff that isn’t necessarily monitored by the script editors and tends to fail silently, such as action or delegate handlers, performSelector commands, folder actions, etc. Handlers shouldn’t be that big anyway ![]()
I have used this approach in the past. In the on error segment of a try block within a handler named “export_file”:
on error errmsg number errnbr
	my error_handler("Export file", errnbr, errmsg)
end try
with the error_handler wrttien as:
on error_handler(handler_name, nbr, msg)
	return display alert handler_name & ": " & "[ " & nbr & " ] " & msg as critical giving up after 10
end error_handler
As I am fairly diligent in breaking up code into small handlers, I find that if I know which handler the error occurred in I can determine the line where it failed.
Consequently I set a property or global variable called “tracehandlers”, normally false.
At the beginning of every handler, I have a line:
If tracehandlers then set the clipboard to (“entering name_of_function “&return& the clipboard)
If the script crashes I set “tracehandlers” to true and run the script again. After the crash, I paste into a textedit document.
Now I have a trace of every handler that was run - I know where the script crashed and how it got there. This is a huge help when debugging.
Clipboard operations are virtual and hence low overhead; if tracehandlers is false the overhead is very low.
You can get a similar result by using try statements, prefixing the handler name to the error message and resignaling the error with the new message to pass it up the chain, letting the script editor put up the error dialog. The granularity can be changed by choosing which handlers have the try statements (you know, only the ones that have bugs) - the error will get passed through all the handlers in the chain regardless. Those with the statements will just add their name, with the one at the end of the line being the one (or hopefully something close) that started it all.
By the way I was just look up a page in the apple official applescript docs and couldn’t help but notice THE DOCS HAVE LINE NUMBERS!!! Line numbers in the docs, because code needs line numbers. But no line numbers in the script editor or error codes.
![]()
(Language in post moderated by NG.)
You must be talking about the Scripting Guide, which is a little newer and includes some JXA - the AppleScript Language Guide doesn’t use line numbers.
Please consider that AppleScript is a powerful but pretty ancient scripting language. It has been introduced more than 30 years ago and hasn’t been actively developed further for more than 10 years.