use AppleScript version "2.4" -- Yosemite (10.10) or later
use scripting additions
(*
###################################################################
# Author :Simon Knight
# Purpose : Parse delimited text file - plot a graph, dates on x axis
# Dated : 2026-01-19
# Last Update : 2026-01-19
# Version : '1.0'
# Build no : 1
###################################################################
License : free to use - The author accepts no risk for any damage
file corruption injury or costs incurred by you the end user
by using this software you the end user accept all risks.
*)
######### READ IN THE CSV Data file #########
set thefile to POSIX path of (choose file with prompt "Please choose a file:" of type {"public.text"})
--set theFile to "/Users/al/Projects/Scala/Sarah/scripts/thank_you.data"
set fileHandle to open for access thefile
set tFile to read fileHandle
close access fileHandle
set tData to text 1 thru -1 of tFile -- comma - newline delimited list of values. may try tabs
######### Parse the Data creating a list of lists #########
--display dialog "The contents " & tData as text
set tid to AppleScript's text item delimiters
set AppleScript's text item delimiters to tab
--set text item delimiters to {","}
set tDataSet to {}
set tMaxValue to 0
repeat with anItem in paragraphs of tData -- paragraph is delimited by newline characters
if contents of anItem is not "" then set tChar to item 1 of anItem
if contents of anItem is not "" and tChar is not "#" and tChar is not tab then -- this skips blank lines, comments and lines starting with tab
set tColour to {}
set tDate to text item 1 of anItem -- note use of 'text item' rather than just item which returns single characters
set tValue to text item 2 of anItem as real
set tRGBStr to text item 3 of anItem as string
set tColour to ColourLst(tRGBStr)
set tLabel to text item 4 of anItem as string
--copy BuildLable(tLabel) to tLabel
set tLabel to BuildLabel(tLabel)
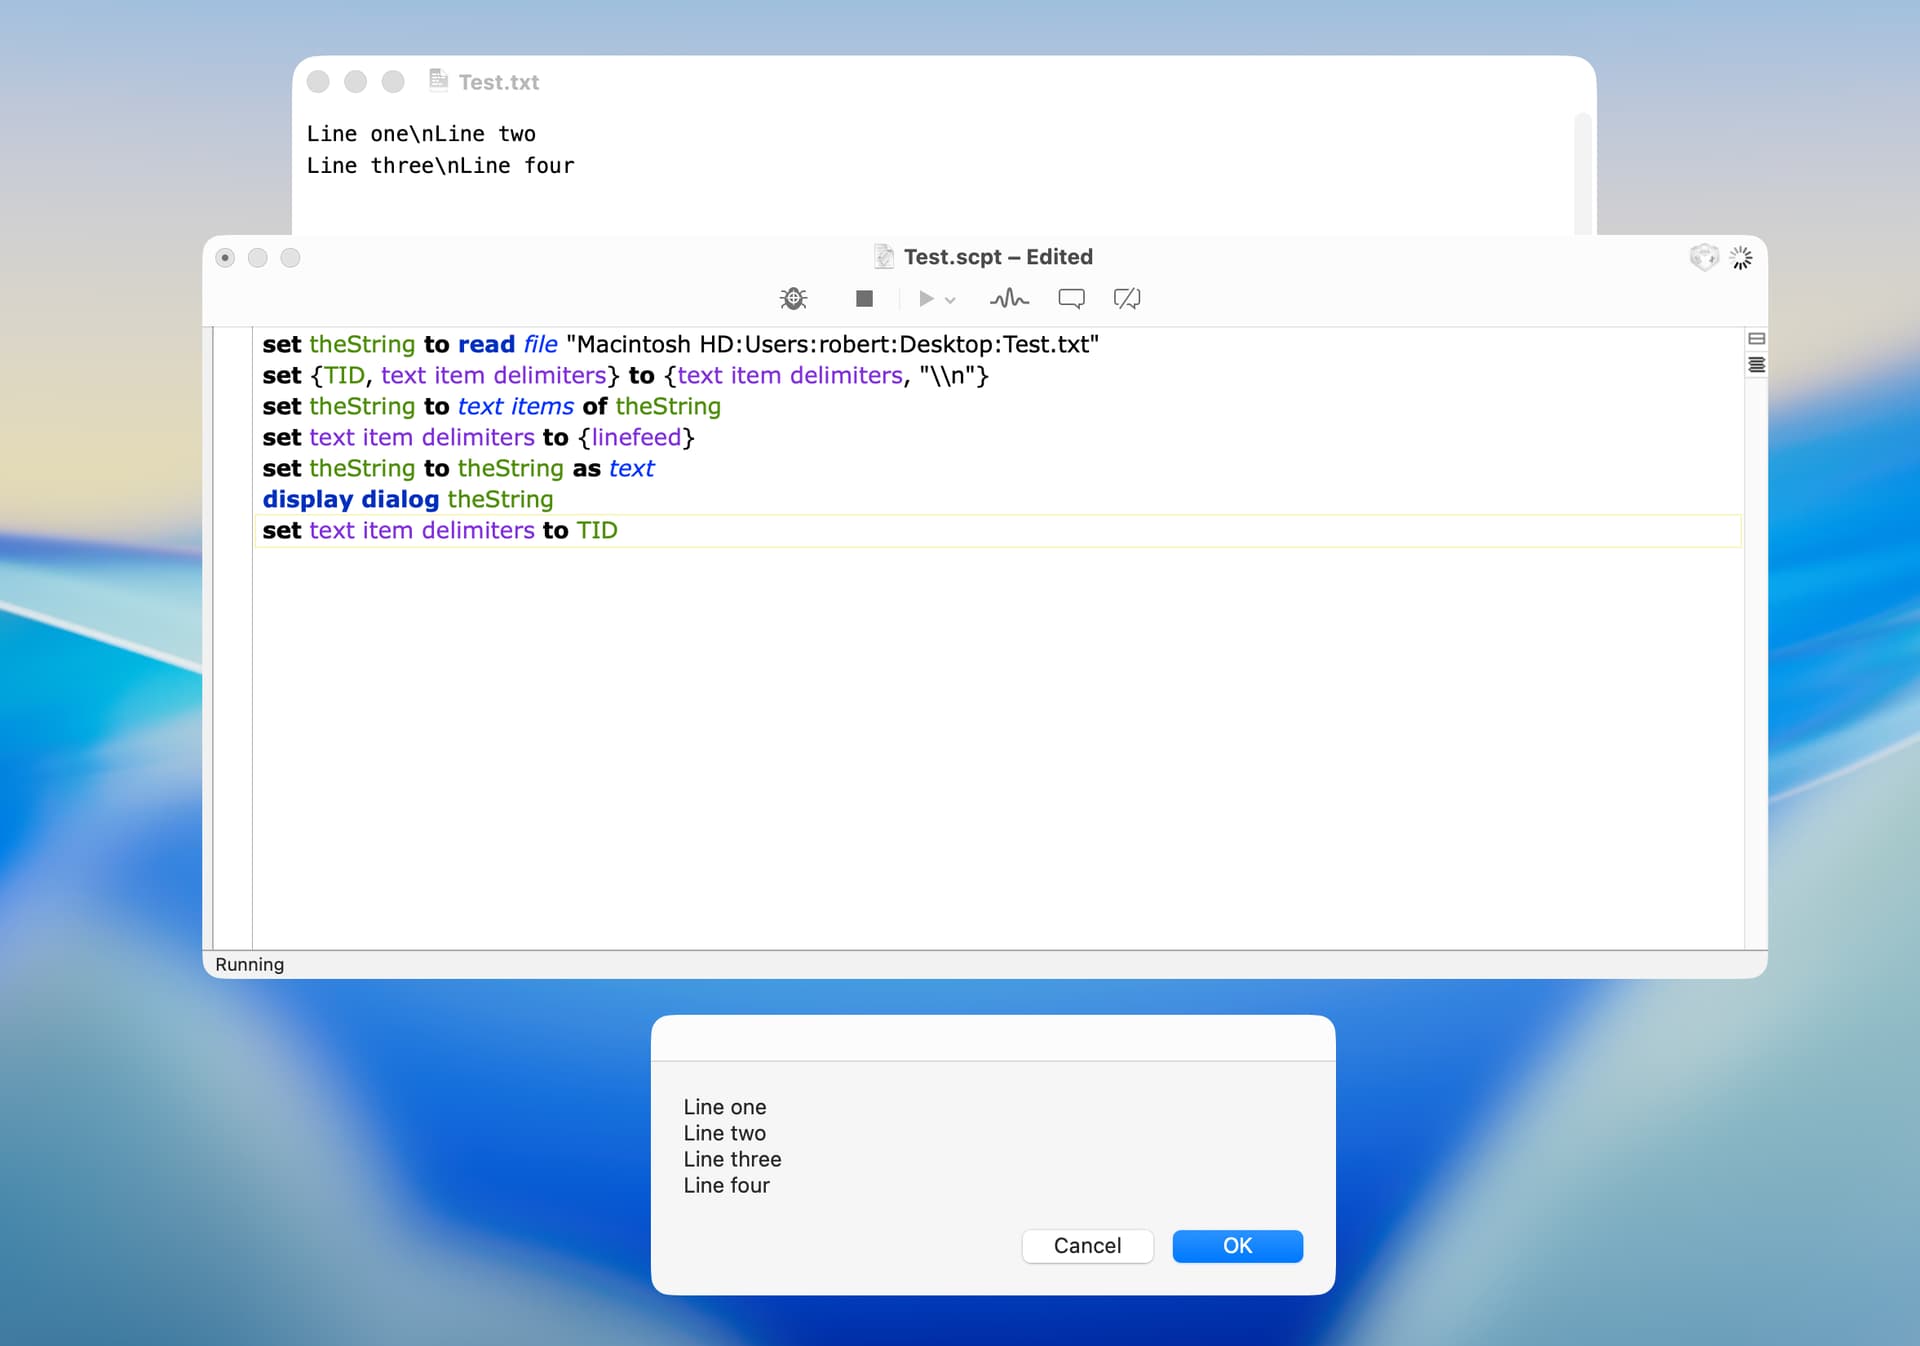
--replace("\\n", linefeed, tLabel) --> linefeeds are escaped in input text with \n
set tSetID to text item 5 of anItem as string
set tType to text item 6 of anItem as string
if tValue > tMaxValue then set tMaxValue to tValue -- used to scale the values below
set PointRec to {SqlDate:tDate, aValue:tValue, ColourLst:tColour, aLabel:tLabel, SetID:tSetID, PlotType:tType}
set end of tDataSet to PointRec
end if
end repeat
## --> tDataSet is now a list of lists. Each inner list comprises two strings SQLdate and a Number value. {SqlDate string, Value as string}
--log "First Plot is on date : " & the SqlDate of item 1 of tDataSetNew
######### Sort the Data oldest to newest based on SQL date #########
-- Old list of lists set tDataSet to SortList(tDataSet) -- note relies on the date being in SQL format yyyy-mm-dd
set tDataSet to SortList(tDataSet) -- note relies on the date being in SQL format yyyy-mm-dd
######## populate the list with the julian day of year, #########
repeat with i from 1 to (count of tDataSet)
set tSqlDate to the SqlDate of item i of tDataSet
set tJulianDay to JulianDate(tSqlDate)
set tYear to theYear(tSqlDate)
set item i of tDataSet to item i of tDataSet & {JulianDay:tJulianDay, theYear:tYear}
end repeat
## Dataset is a list of lists
### Each inner list is now in form {JulianDay as int, Year as int, Original X value as a SqlDate as string, Original Y Value from file as string}
######## Now calculate the day difference from 1st Jan of year of first entry ########
## read the start year which is stored in item 1 of the list
set tStartYear to theYear of item 1 of tDataSet
set tDaysElasped to 0 -- initialy calculated from the years that have elapsed
## each inner list is in form {JulianDay as int, Year as int, Original X value as a SqlDate as string, Original Y Value from file as string}
repeat with i from 1 to (count of tDataSet)
set tYearDataPoint to the theYear of item i of tDataSet -- read the year stored as integer
set tDaysElapsed to ElapsedDays(tStartYear, tYearDataPoint)
set tDaysElapsed to tDaysElapsed + (the JulianDay of item i of tDataSet)
set item i of tDataSet to item i of tDataSet & {DaysElapsed:tDaysElapsed}
end repeat
## each inner list is in form {Number of Days Elapsed,JulianDay,Year,Original X value as a SqlDate,Original Y Value from file}
## where the days elasped is counted from the 1st Jan of the first year.
## Now in a position to scale the X and Y data values stored in item 1 and last item respectivily
###! Days elapsed is counted from 1st Jan of earliest year.
######## OmniGraffle Notes ########
# OG plots the location of objects from the top left of the screen which is at X=0, Y=0
# Previous scripts plot the position in points which are 1/72nd of an inch
# The present X Y values have to be scaled to fit on the A3 page
# The first try will be with a graph area of 1077pts by 683 starting at graph origin of 60,60
# To plot graph data points the Y posn has to be inverted to plot down the page
## Use an A3 Landscape size canvas, allows user edits and then it can be copied as PDF and resized as necessary
set thePageWidth to 1155
set thePageHeight to 784
## Define the size of the graph area on page in points or 1/72nd of an inch.
## These are used to scale the datapoints in the data set
set graphTop to 25
set graphBtm to 740
set graphLeft to 77
set graphRight to 1100
## graph will scale to include complete years.
## Calculate the number of days including leap years to use as a scaling factor
set tTotalDaysElapsed to ElapsedDays(tStartYear, ((the theYear of the last item of tDataSet) + 1))
## Now set the maximum value to be plotted
set tMaxY to ((tMaxValue * 1.05) div 1) + 1 -- ensure a little headroom
# set a value governs the ticks and labels on Y axis, see below
if tMaxY > 80 then
set tModFactor to 10
else if tMaxY > 20 then
set tModFactor to 5
else
set tModFactor to 2
end if
## A date is plotted at a number of points from the left margin of the graph
## It is calculated by dividing the graph X axis in points by the total number of days to be represented
## multiplied by the plots elapsed days value
set graphXaxis to (graphRight - graphLeft)
set graphXScaleFactor to (graphXaxis / tTotalDaysElapsed)
set graphYaxis to graphBtm - graphTop
set graphYScaleFactor to graphYaxis / tMaxY
## the complication is that OmniGraffle plots from top left of screen
repeat with i from 1 to (count of tDataSet)
set tDaysElapsed to the DaysElapsed of item i of tDataSet
set tXpoints to tDaysElapsed * graphXScaleFactor
set tValue to (the aValue of item i of tDataSet)
set tYpoints to tValue * graphYScaleFactor
## tXpoint and tYpoints are from the origin of graph
## and have to be converted to fit the graph co-ordinates
set tXpoints to tXpoints + graphLeft
set tYpoints to graphBtm - tYpoints
set item i of tDataSet to item i of tDataSet & {XPoints:tXpoints, Ypoints:tYpoints}
end repeat
## Dataset should now be ready to be plotted
set myDocumentName to "DatePlot"
tell document 1 of application "OmniGraffle"
set page breaks visible to false
set myCanvas to the first canvas of document 1 of application "OmniGraffle"
set thePageSize to {thePageWidth, thePageHeight}
tell myCanvas
set adjusts pages to true
set canvas size is measured in pages to false
set canvasSize to thePageSize
-- Draw the X and Y axis - L shape
make new line at end of graphics with properties {point list:{{graphLeft, graphTop}, {graphLeft, graphBtm}, {graphRight, graphBtm}}, draws shadow:false}
set tPlotSize to 10
set tCoOrds to {} -- in future make this a list of lists depending oi data set number
## loop the dataset plotting points
repeat with i from 1 to (count of tDataSet)
set tX to the XPoints of item i of tDataSet
set tY to (the Ypoints of item i of tDataSet) - (tPlotSize / 2)
set tValue to the aValue of item i of tDataSet as string
set tDate to the SqlDate of item i of tDataSet
set tNote to tDate & " PSA " & tValue & linefeed & aLabel of item i of tDataSet
if the PlotType of item i of tDataSet is "Plot" then
## store a list of points
--set end of tDataSet to PointRec
set tPoint to {tX + (tPlotSize / 2), tY + (tPlotSize / 2)}
set end of tCoOrds to tPoint
## plot a test point
make new shape at end of graphics with properties {name:"Circle", textSize:{0.8, 0.7}, draws shadow:false, locked:true, size:{tPlotSize, tPlotSize}, origin:{tX, tY}, textPosition:{0.1, 0.15}, stroke color:{0.5, 0.5, 0.5}, fill color:the ColourLst of item i of tDataSet}
set the notes of the last shape to tNote
## plot the descrption text
make new shape at end of graphics with properties {fill:no fill, draws stroke:false, locked:true, draws shadow:false, autosizing:full, size:{45.03418, 26.458008}, text:{size:14, color:the ColourLst of item i of tDataSet, font:"ArialMT", text:aLabel of item i of tDataSet}, allows connections:false, origin:{tX - 17, tY - tPlotSize * 2}, thickness:2}
end if -- select on plots
# draw a vertical line down graph
if the PlotType of item i of tDataSet is "vLine" then
make new line at end of graphics with properties {point list:{{tX, graphBtm}, {tX, graphTop}}, draws shadow:false, stroke color:{0.499988, 0.5, 0.5}}
end if
# draw text on a stick
if the PlotType of item i of tDataSet is "flag" then
make new line at end of graphics with properties {point list:{{tX, graphBtm}, {tX, tY}}, draws shadow:false, stroke color:the ColourLst of item i of tDataSet, head type:"FilledBall", tail type:"FilledArrow"}
--make new shape at end of graphics with properties {fill:no fill, draws stroke:false, locked:true, draws shadow:false, autosizing:full, size:{45.03418, 26.458008}, text:{size:14, color:the ColourLst of item i of tDataSet, font:"ArialMT", text:aLabel of item i of tDataSet}, allows connections:false, origin:{tX - 17, tY - tPlotSize * 2}, thickness:2}
make new shape at end of graphics with properties {corner radius:4, draws stroke:true, locked:true, draws shadow:false, autosizing:full, size:{45.03418, 26.458008}, text:{size:14, alignment:center, color:the ColourLst of item i of tDataSet, font:"ArialMT", text:aLabel of item i of tDataSet}, allows connections:false, origin:{tX - 22, tY - 28}, thickness:2, stroke color:the ColourLst of item i of tDataSet}
end if
end repeat
# draw a line between plots -- future allow multiple data sets
if the length of tCoOrds > 0 then
# draw the line that links the plots
make new line at end of graphics with properties {point list:tCoOrds, draws shadow:false, stroke color:{0.499988, 0.5, 0.5}}
end if
## Add the Y axis values
## Create a list of Y axis adornments
repeat with i from 1 to tMaxY
set tY to i * graphYScaleFactor
set tY to graphBtm - tY -- invert cords to fit graph origine
set tText to i as string
if i mod tModFactor is 0 then
# text label
make new shape at end of graphics with properties {fill:no fill, draws stroke:false, draws shadow:false, autosizing:full, size:{25.572266, 26.458008}, text:{size:14, color:{0.69412, 0.0, 0.1098}, font:"ArialMT", text:tText}, allows connections:false, origin:{graphLeft - 45, tY - 14}, thickness:2}
# Long Tick on Y axis
make new line at end of graphics with properties {point list:{{graphLeft - 20, tY}, {graphLeft, tY}}, draws shadow:false, stroke color:{0.499988, 0.5, 0.5}}
else
# Tick on Y axis
make new line at end of graphics with properties {point list:{{graphLeft - 10, tY}, {graphLeft, tY}}, draws shadow:false, stroke color:{0.499988, 0.5, 0.5}}
end if
end repeat
## Add the Y axis values
set tStartYear to the theYear of item 1 of tDataSet
set tEndYear to the theYear of the last item of tDataSet
set xTick to 0
set xLabel to 0
repeat with i from tStartYear to tEndYear
if my IsLeapYear(i) then
set tDaysInYear to 366
else
set tDaysInYear to 365
end if
set xTick to xTick + (tDaysInYear * graphXScaleFactor)
set xLabel to xTick - (tDaysInYear * graphXScaleFactor / 2) - 8
# draw tick on axis
make new line at end of graphics with properties {point list:{{xTick + graphLeft, graphBtm}, {xTick + graphLeft, graphBtm + 10}}, draws shadow:false, stroke color:{0.499988, 0.5, 0.5}}
# add text lable (year)
make new shape at end of graphics with properties {fill:no fill, draws stroke:false, draws shadow:false, autosizing:full, size:{25.572266, 26.458008}, text:{size:14, color:{0.69412, 0.0, 0.1098}, font:"ArialMT", text:i as text}, allows connections:false, origin:{xLabel + graphLeft, graphBtm + 0}, thickness:2}
end repeat
end tell
end tell
--set AppleScript's text item delimiters to tid
--set AppleScript's text item delimiters to tid
############ END OF MAIN PROGRAM BODY ############
on ColourLst(pRGBStr)
# passed a string of three comma numbers each in range 0-255
# Returns a list of colour codes that OmniGraffle can process
local tRed
set tid to AppleScript's text item delimiters
set AppleScript's text item delimiters to ","
set ColourList to {}
set tRed to (text item 1 of pRGBStr as integer) / 255
set tGreen to (text item 2 of pRGBStr as integer) / 255
set tBlue to (text item 3 of pRGBStr as integer) / 255
set end of ColourList to tRed
set end of ColourList to tGreen
set end of ColourList to tBlue
set AppleScript's text item delimiters to tid
return ColourList
end ColourLst
on BuildLabel(pLabel)
local tCount, tText
set tid to AppleScript's text item delimiters
set AppleScript's text item delimiters to "/n"
set tText to ""
set tCount to the number of text items in pLabel
repeat with i from 1 to tCount
if tText is "" then
set tText to text item i of pLabel
else
set tText to tText & linefeed & the text item i of pLabel
end if
end repeat
set AppleScript's text item delimiters to tid
return tText
end BuildLabel
on ElapsedDays(pFirstYear, pYearDataPoint)
-- passed by ref two integers which represent years e.g. 2015
-- calculated the number of days beteen Jan 1st of the first year
-- and 31st Dec of the previous year i.e. 2014
set tDayCount to 0
if pYearDataPoint = pFirstYear then
return tDayCount -- the juliandays value is what will be worked with
else
set tLastFullYear to pYearDataPoint - 1
set tDeltaYears to tLastFullYear - pFirstYear
repeat with i from 0 to tDeltaYears -- if tDeltaYears is 1 it should run once
set tYear to pFirstYear + i
if IsLeapYear(tYear) then
set tDayCount to tDayCount + 366
else
set tDayCount to tDayCount + 365
end if
end repeat
return tDayCount
end if
end ElapsedDays
on theYear(pSqlDate)
set tid to AppleScript's text item delimiters
set AppleScript's text item delimiters to "-"
set tYear to text item 1 of pSqlDate as integer
set AppleScript's text item delimiters to tid
return tYear
end theYear
--on NumDaysInYear(pSqlDate)
-- set tid to AppleScript's text item delimiters
-- set AppleScript's text item delimiters to "-"
-- set tYear to text item 1 of pSqlDate as integer
-- set AppleScript's text item delimiters to tid
--
-- if IsLeapYear(tYear) then
-- return 366
-- else
-- return 365
-- end if
--end NumDaysInYear
on SortList(pList)
-- This is a bubble sort that conducts a sort based on the text values SqlDate
-- of each of the records in the list. This is expected to be a SQL date yyyy-mm-dd
-- It does not work correctly with string copies of numbers
repeat with i from 1 to (count of pList) - 1
repeat with j from i + 1 to count of pList
if the SqlDate of item j of pList < the SqlDate of item i of pList then
set temp to item i of pList
set item i of pList to item j of pList
set item j of pList to temp
end if
log pList
end repeat
end repeat
return pList
end SortList
--on SortList(pList)
-- -- This is a bubble sort that conducts a sort based on the text values in item 1
-- -- of each of the sub lists. This is expected to be a SQL date yyyy-mm-dd
-- -- It does not work correctly with string copies of numbers
--
-- repeat with i from 1 to (count of pList) - 1
-- repeat with j from i + 1 to count of pList
-- if item 1 of item j of pList < item 1 of item i of pList then
-- set temp to item i of pList
-- set item i of pList to item j of pList
-- set item j of pList to temp
-- end if
-- log pList
-- end repeat
-- end repeat
-- return pList
--end SortList
on JulianDate(pSqlDate)
local tYear
local tDays, tmonth, tDay
set YearDaysbyMonth to {31, 28, 31, 30, 31, 30, 31, 31, 30, 31, 30, 31}
set LeapYearDaysbyMonth to {31, 29, 31, 30, 31, 30, 31, 31, 30, 31, 30, 31}
set tid to AppleScript's text item delimiters
set AppleScript's text item delimiters to "-"
set tYear to text item 1 of pSqlDate as integer
set tmonth to text item 2 of pSqlDate as integer
set tDay to text item 3 of pSqlDate as integer
set tDays to 0
if (IsLeapYear(tYear) = false) and tmonth > 1 then
repeat with i from 1 to (tmonth - 1)
set tDays to tDays + (item i of LeapYearDaysbyMonth) as integer
end repeat
else
repeat with i from 1 to (tmonth - 1)
set tDays to tDays + (item i of YearDaysbyMonth) as integer
end repeat
end if
set tDays to tDays + tDay
set AppleScript's text item delimiters to tid
return tDays
end JulianDate
on IsLeapYear(pYear)
--check for Leap Years
set LeapYear to false
if pYear mod 4 = 0 and pYear mod 100 ≠ 0 then --is a leap year
set LeapYear to true
end if
if pYear mod 100 = 0 and pYear mod 400 = 0 then -- is a leapyear
set LeapYear to true
end if
return LeapYear
end IsLeapYear
on replace(A, B, theText)
set L to length of A
set K to L - 1
set P to offset of A in theText
repeat until P = 0
if P = 1 then
set theText to B & text (L + 1) through -1 of theText
else if P = (length of theText) - K then
set theText to text 1 through -(L + 1) of theText & B
else
set theText to text 1 through (P - 1) of theText & B & text (P + L) through -1 of theText
end if
set P to offset of A in theText
end repeat
return theText
end replace
This script is a work in progress and basically works. At the moment I am adding the ability to add multi line comments / labels via the TSV file and the use of the \n string. This version uses /n because I struggled with \n.